Since my last article, Flux has made a lot of progress. Along with their plugins for Excel, Grasshopper and Dynamo, the Flux team has recently released their connectors for Revit and SketchUp. They are also developing a series of tools that use the Flux platform for calculations or specific collaboration tasks.
Among these tools, Thomas points me to the Live Data Dashboard, a real-time visualization tool for your Flux data.
I have tried various solution for displaying data extracted from a Revit model, from Excel spreadsheet to Tableau, but these solutions generally fell short when it comes to real-time update. The Dashboard can be a solution, since its values always reflect the latest Flux values.
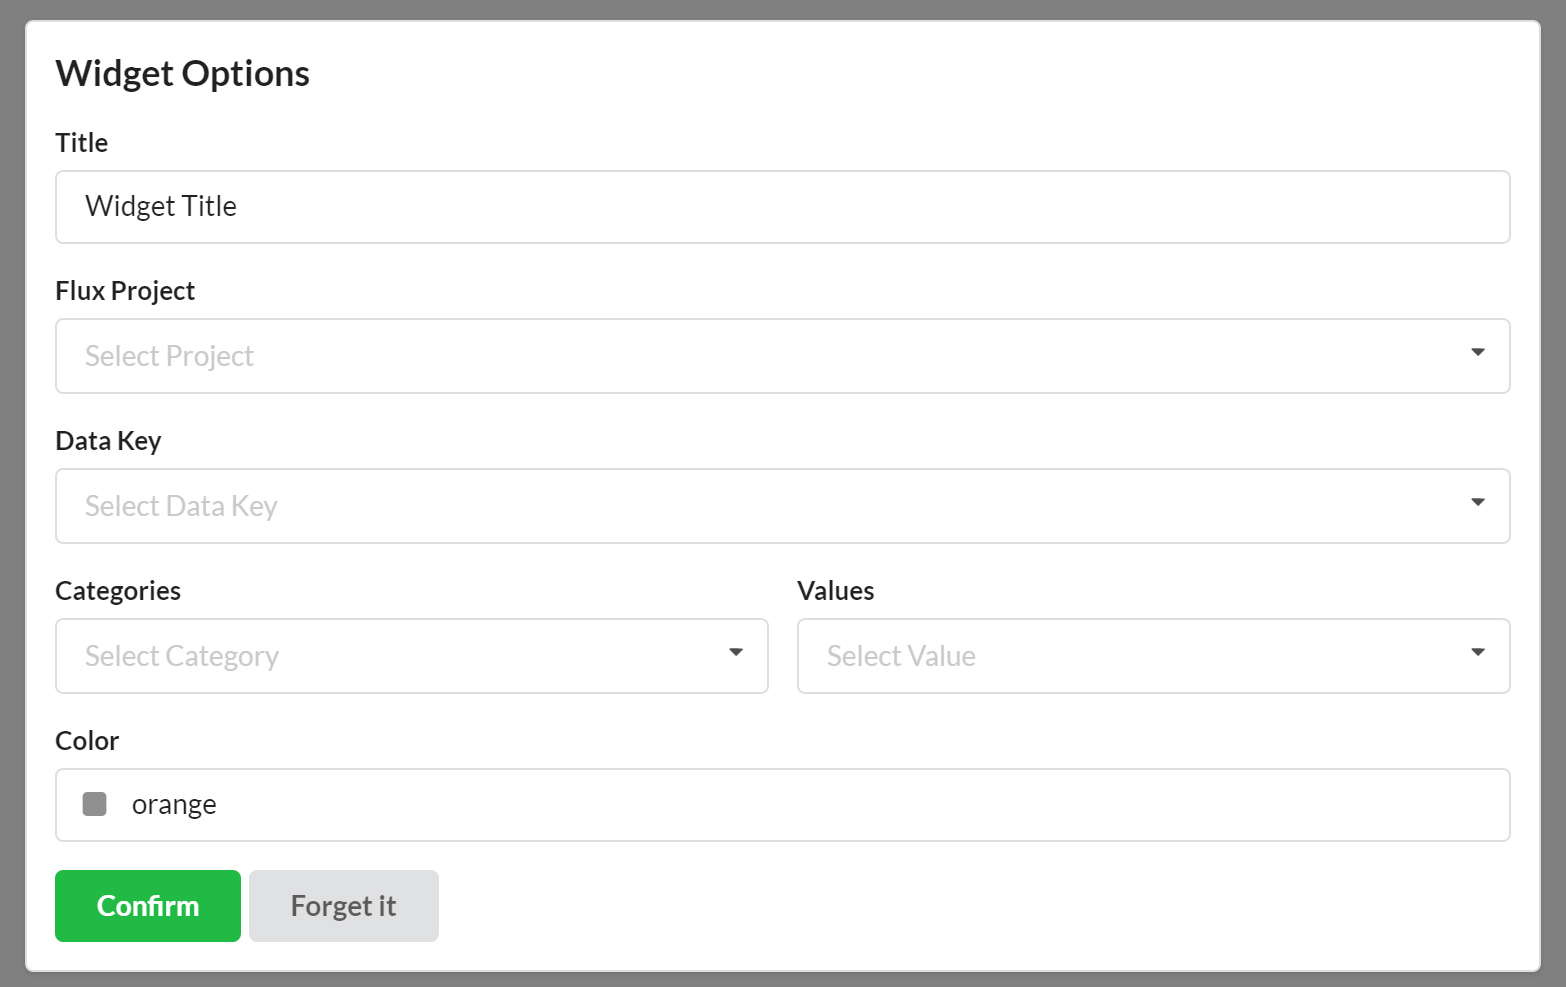
After login with my Flux account into the Flux Dashboard, I was able to select a Data Key from one of my project as a data source for a bar chart.
Using properties extracted from the Rooms of one of my project, I tried to display my 951 rooms all at one, and came up with a rather messy chart:
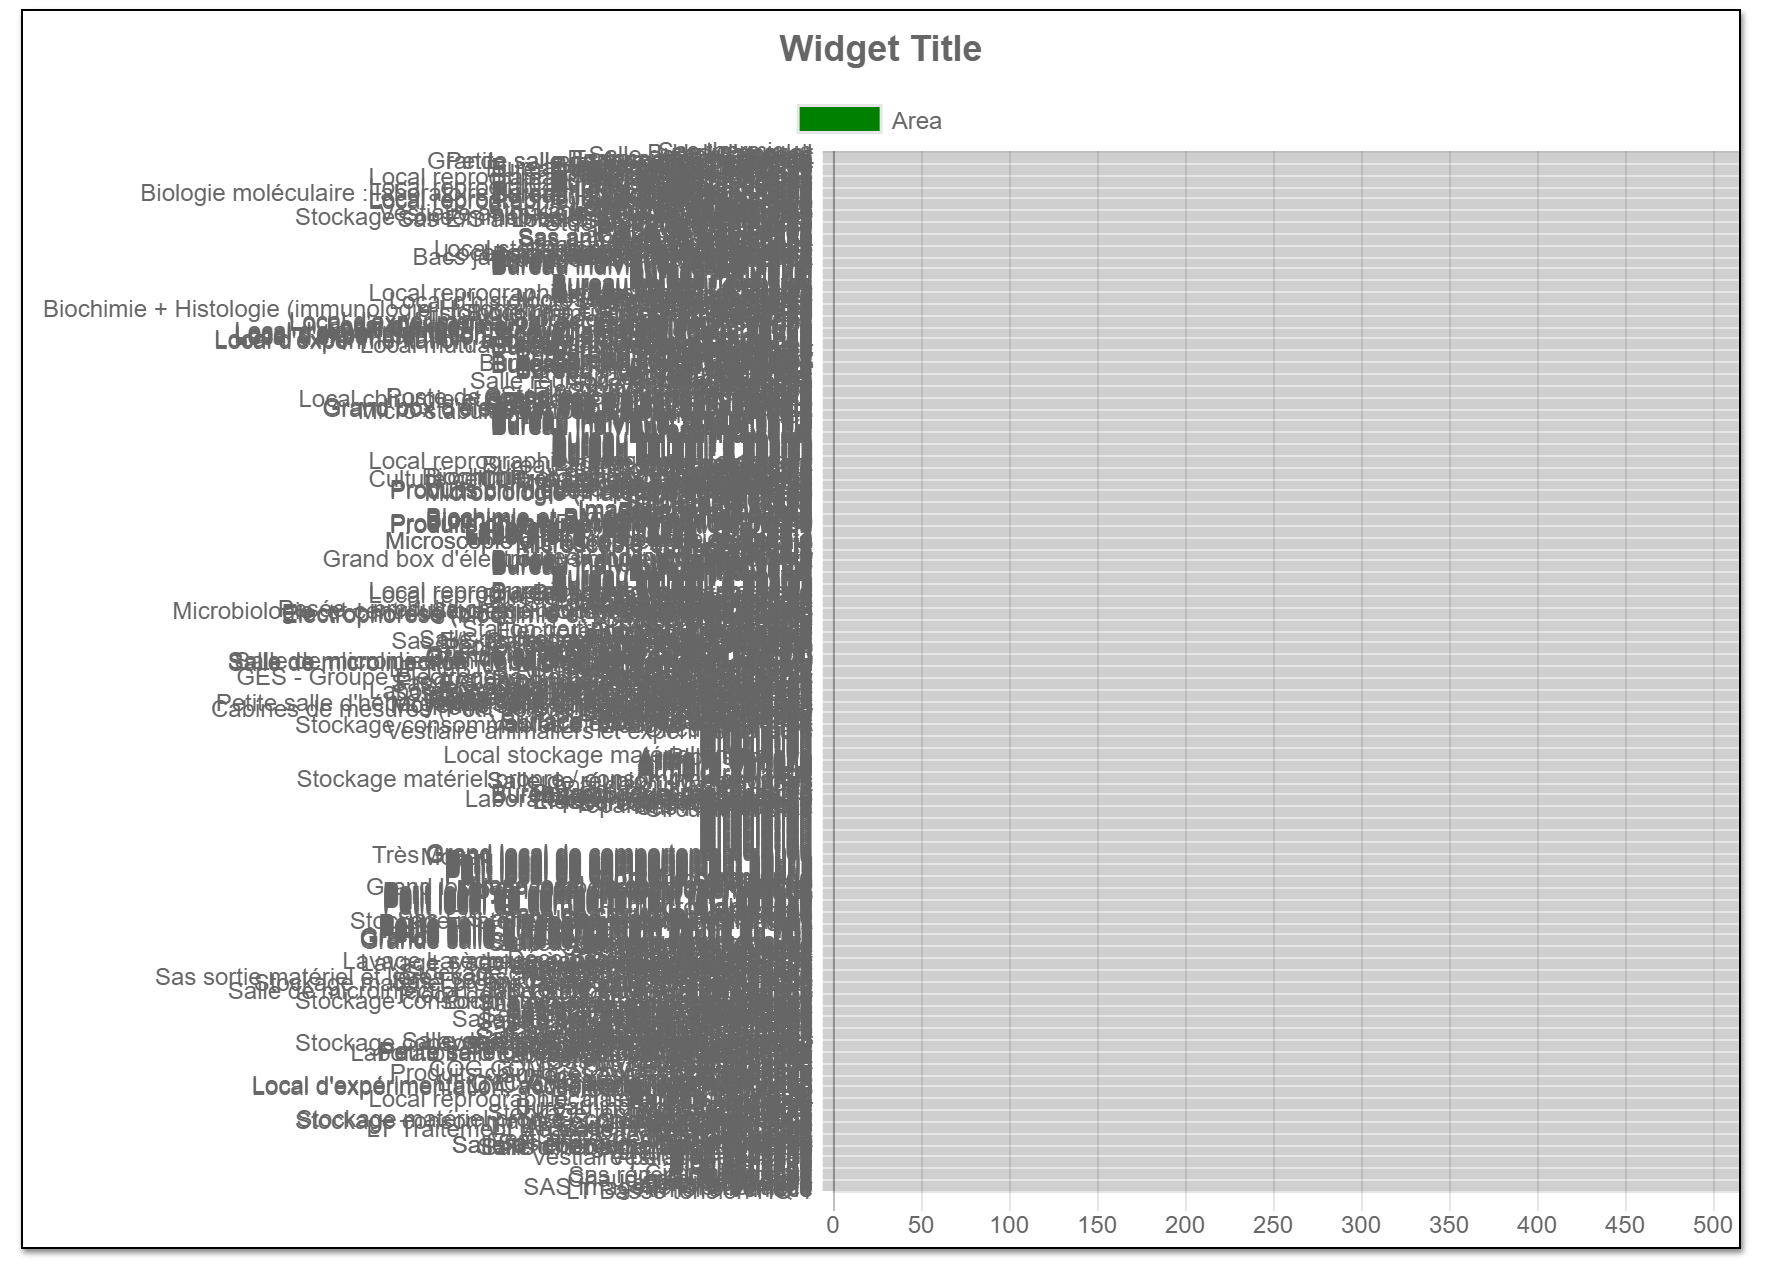
The problem here is that the Flux dashboard does not support values that are not in a tabular format, with mean you cannot yet use directly the value uploaded from the Revit plugin. Furthermore, the Dashboard does not process any of the data you are feeding in, so you have to prepare your visualization beforehand, in Dynamo or in the Flux Flow.
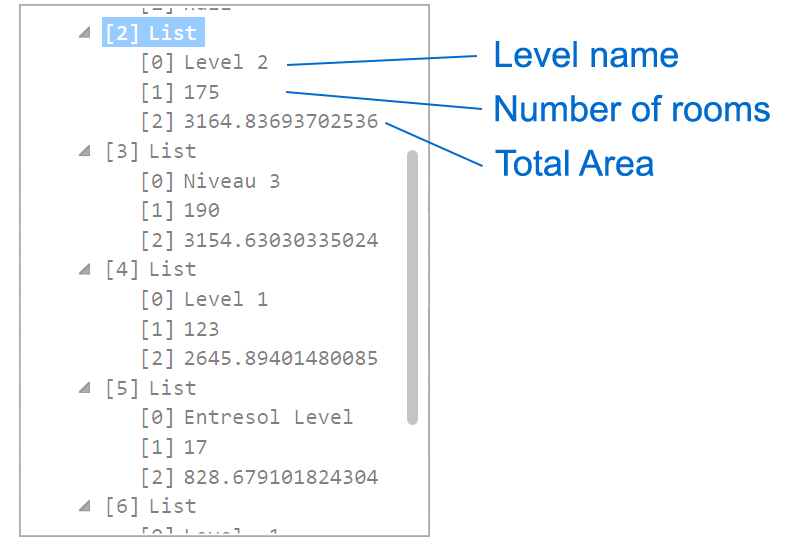
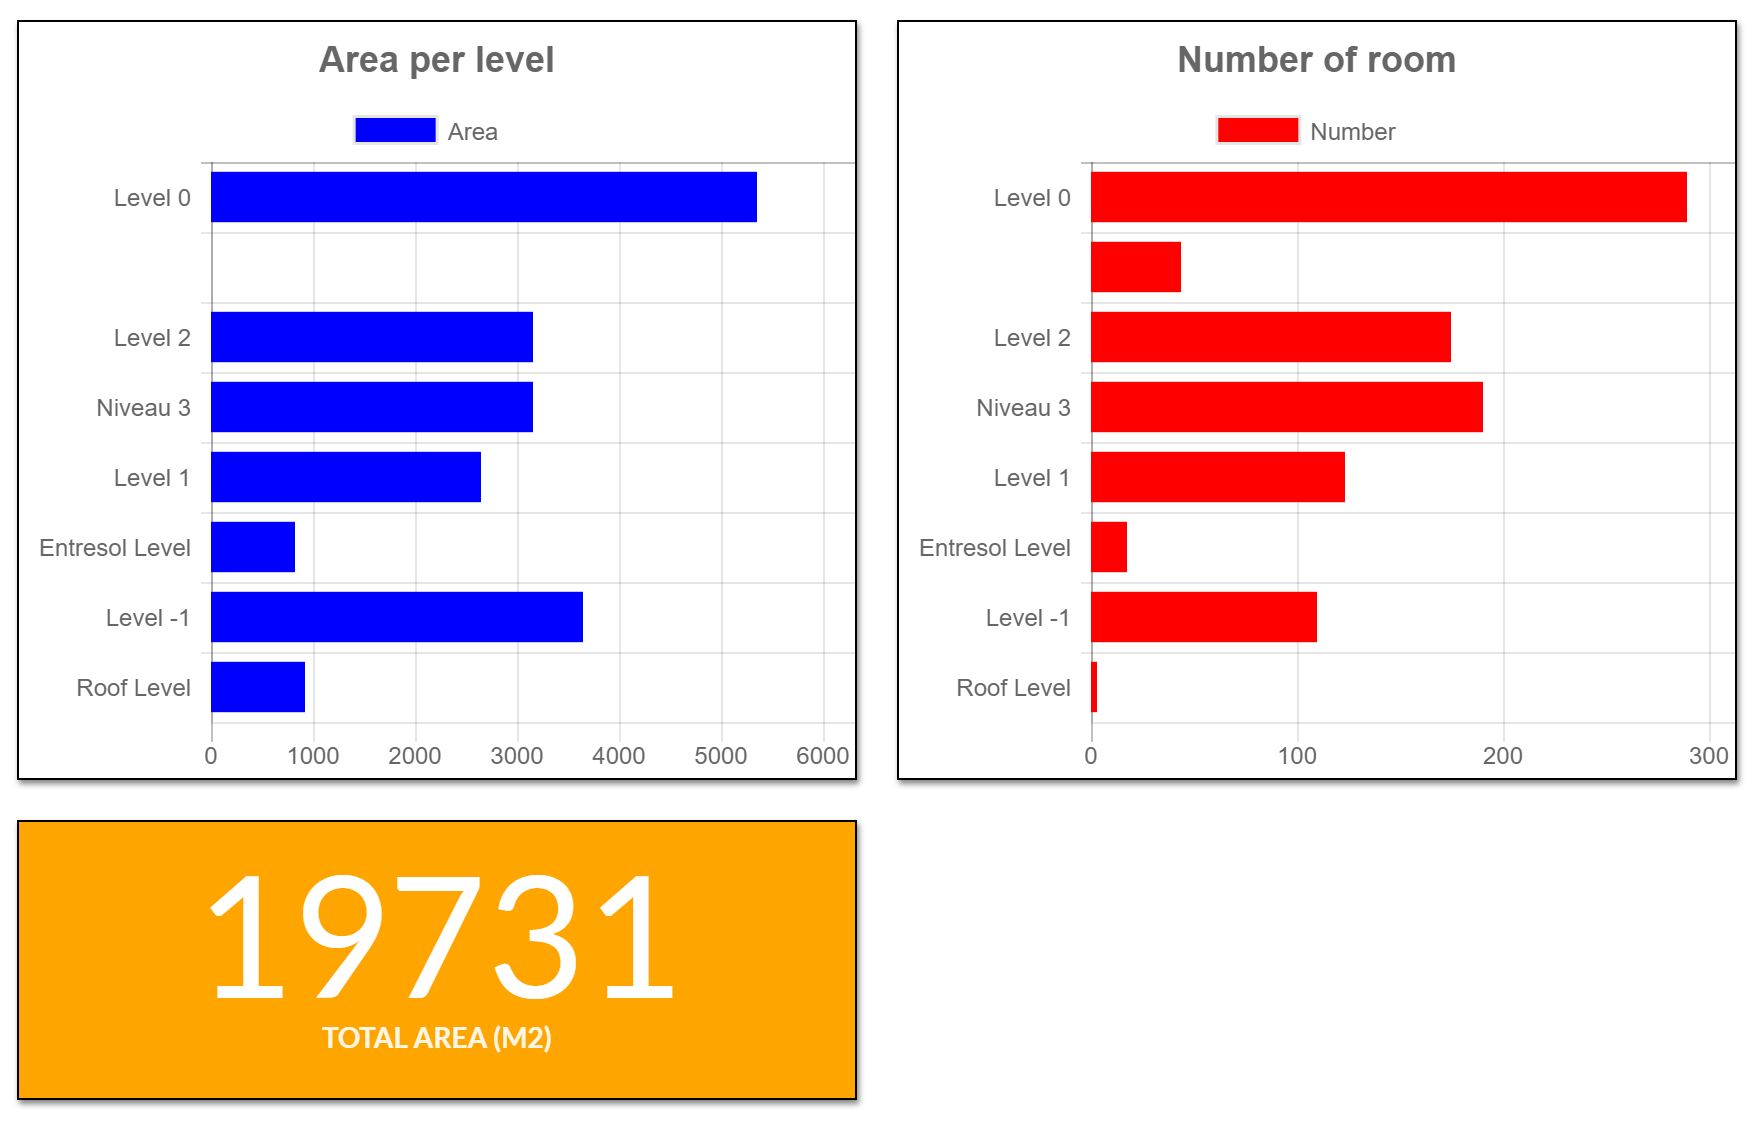
I go back to the Dynamo plugin, and use a rather simple definition to retrieve all rooms, and regroup key values in nested lists. I use the List.GroupByKey node to regroup rooms’ area per level, and create a list of levels, with the number of room and their area in each level.
I upload these values in a new Flux Data Key, and use this Data Key as a source for a new, and way more interesting Chart Bar.
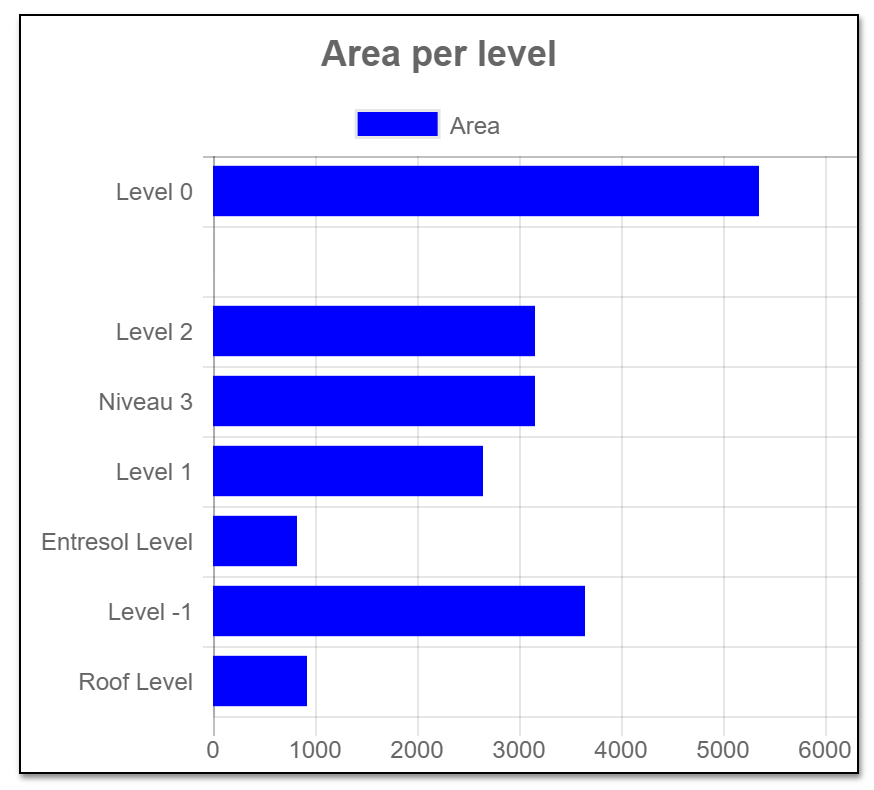
Once the values are properly sorted in Dynamo, they fit nicely on the graph, and are automatically updated as the values evolve in our Revit model.
Using the same principle, I add a few node to my Dynamo definition, and upload the resulting values to the Dashboard.
I also try to display geometry in the Flux Viewport, but for some reason, I wasn’t able to see anything on the dashboard. I will have to keep trying on this one.
After having built this great dashboard, it is pretty easy to share it, using a Flux Data Key to store it. You just have to make sure everyone has access to all the projects linked to the dashboard.
The Flux Dashboard is a great idea. As long as you use Flux as the main data repository, the Flux Dashboard can display is fair share of information to everyone without having to dig into the models. However, the Flux dashboard is not (yet) an Excel spreadsheet, and won’t regroup or sort your data directly, and you still have some work upfront to prepare this data for visualization.