It has been a while since I wanted to play with InfraWorks, but I never had the chance, nor any purpose until recently, when I start to ponder on retrieving existing conditions to integrate future buildings in existing conditions, without having to rely on time-consuming on-site surveys.
When starting with InfraWorks, the easiest way to create a model is to use the Model Builder. This feature use data from OpenStreetMap and Microsoft Bing Maps to create fully featured models, with terrain, roads, orthophoto, and so on.
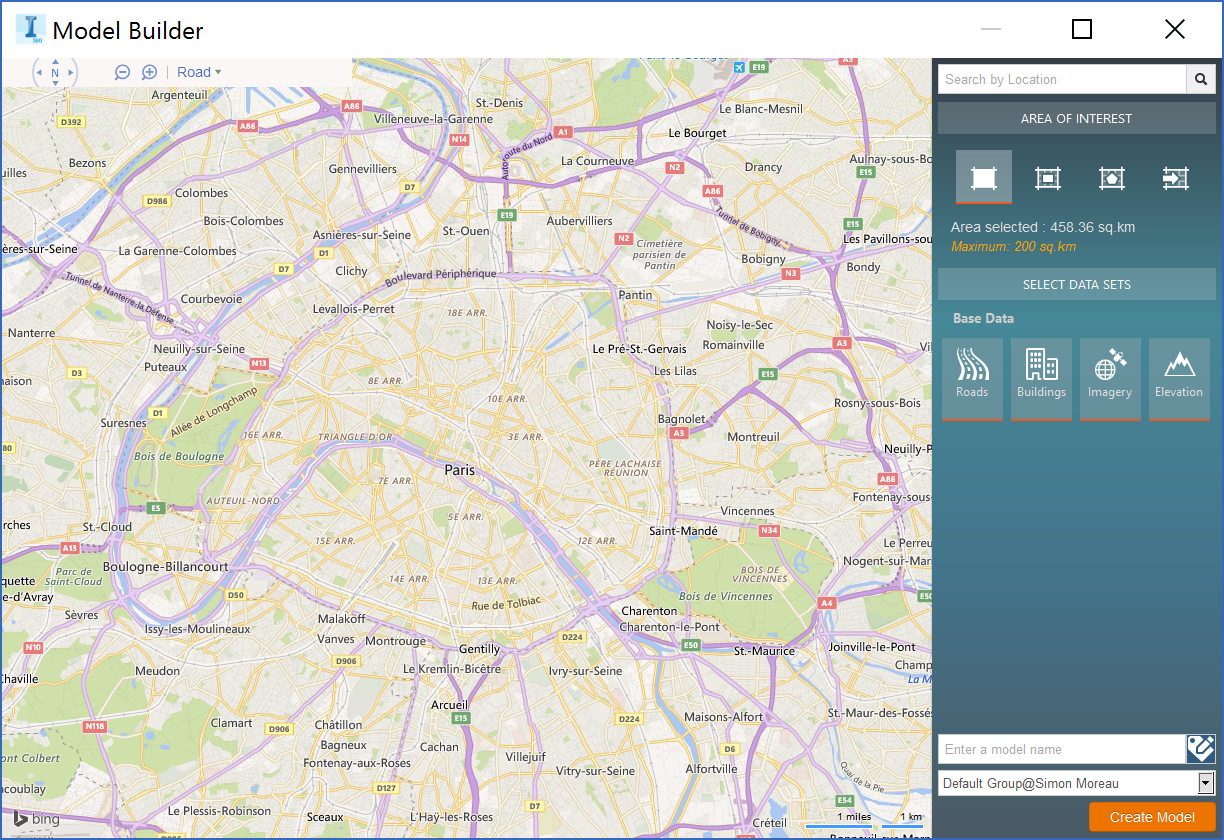 The Model Builder interface
Using this Model Builder, I quickly create a complete 3D model of Paris.
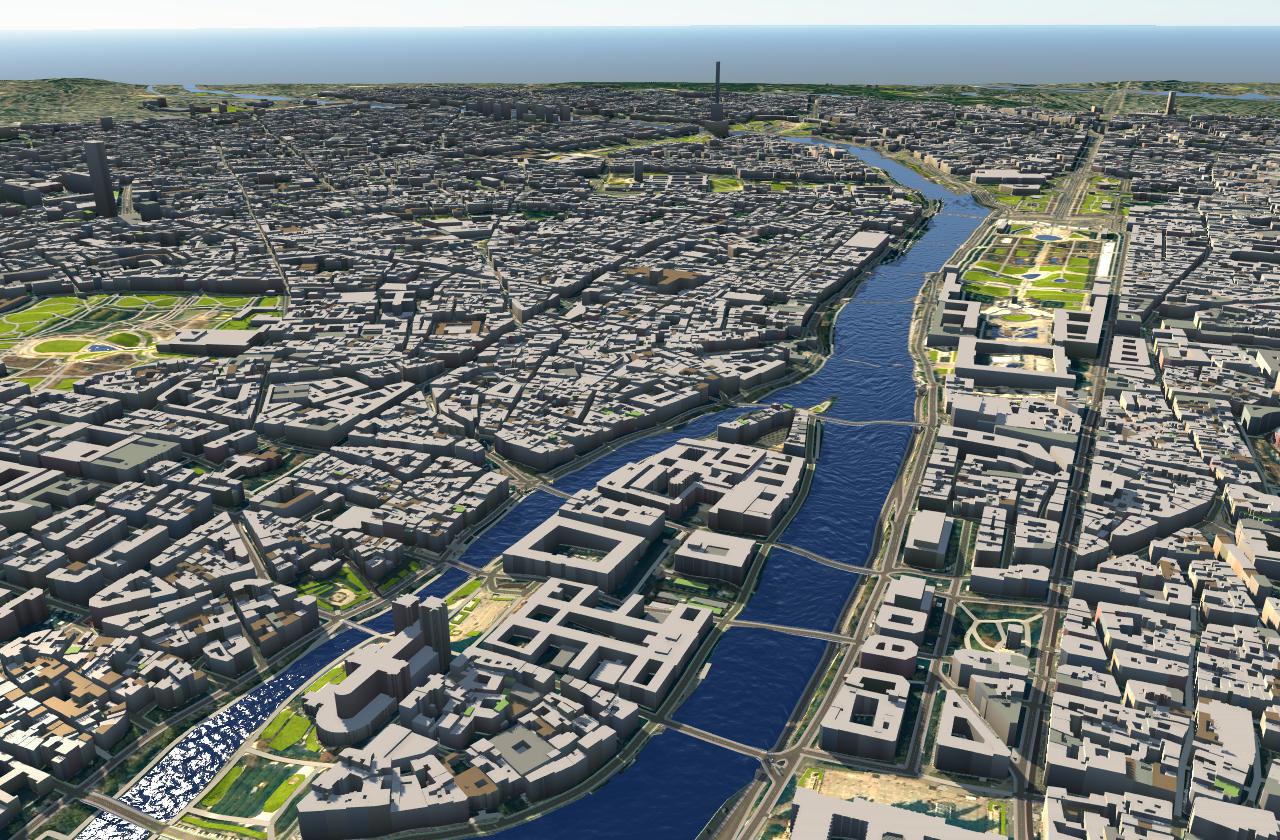 The initial model created from OpenStreetMap
However, this model is not accurate enough for any practical application. For example, the 10-stories building where I live is modeled as a 2 levels building. My idea was to use these buildings for site integration and lighting solar studies, but building heights provided by OpenStreetMap is not reliable enough, I had to find another data source.
I am quite envious of the data used to build Google Maps, which can provide us a 3D model of every building, based on 45-degree aerial imagery. But these data are obviously not easily available, and I fall back on open data.
APUR, the Paris Urban Planning Agency provide an Open Data platform with a lot of datasets about Paris and its suburbs.
Their “EMPRISE BATIE PARIS” dataset contains every building in Paris in Shapefile format. Importing it in InfraWorks is quite easy, but this dataset must be configured to map its values with InfraWorks features.
To do so, it is necessary to map the information contained in the dataset to the property of building objects in InfraWorks.
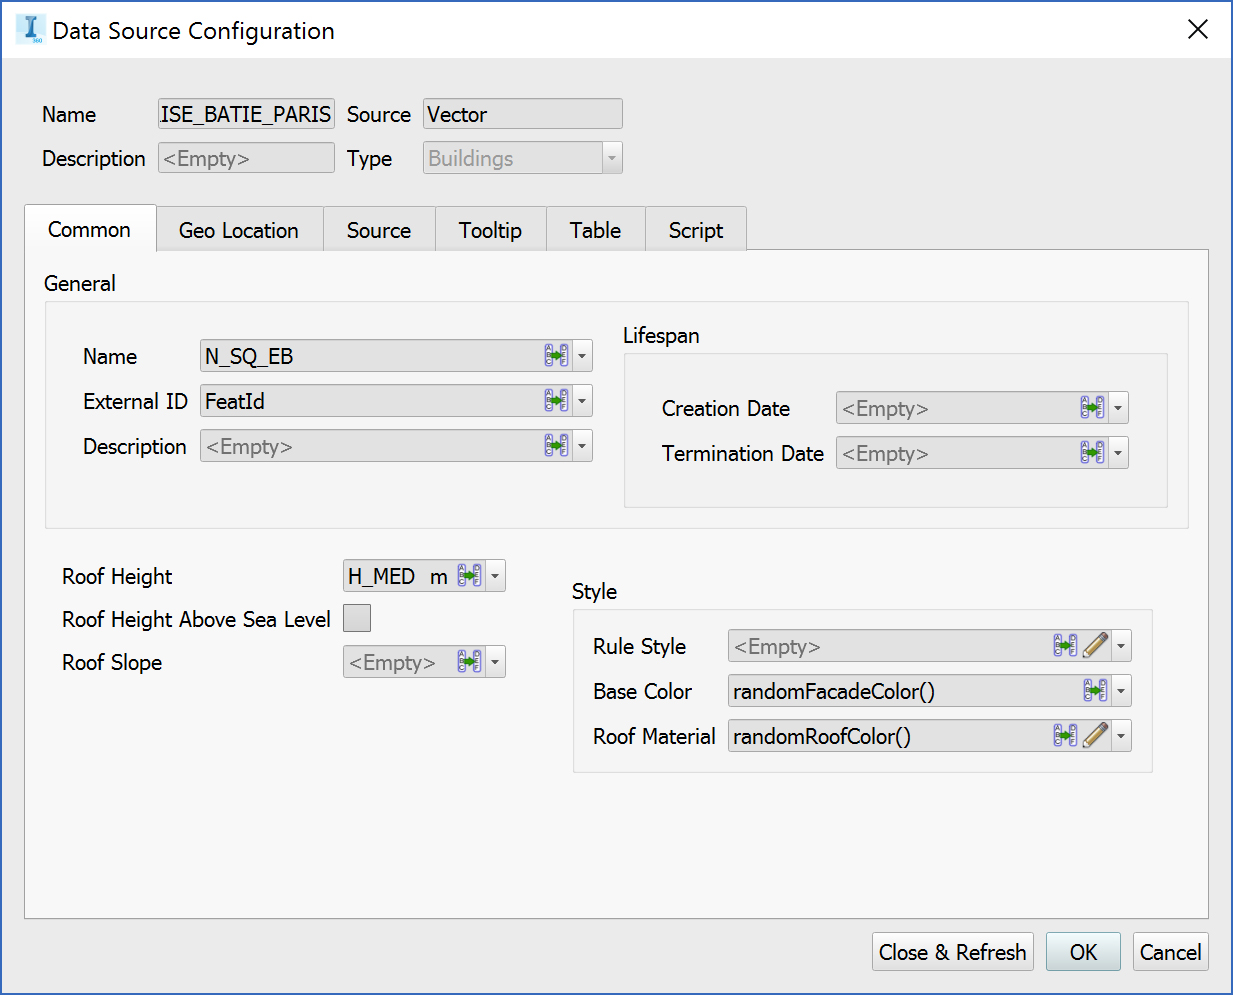 Configuring the dataset
Some properties, like Roof Height, can be easily filled with data coming from the APUR dataset. However, this dataset is far richer than that, and I wanted some specific information, like construction date, to be imported in InfraWorks as custom properties.
To create these custom fields, I have to edit the “im.schema.json” file located in “%USERPROFILE%\Documents\Autodesk InfraWorks Models\Autodesk 360\modelNumber\modelName.files\unver. Using the indications found here, I edit this JSON file to create five custom fields for the “Building” class in InfraWorks: Construction Date, Refurbishment Date, IHG (Hight-Rise Building), Roof Height Standard Deviation and Roof Type. These fields are then mapped to the corresponding values found in the APUR dataset, using the Table tab in “Data Source Configuration”.
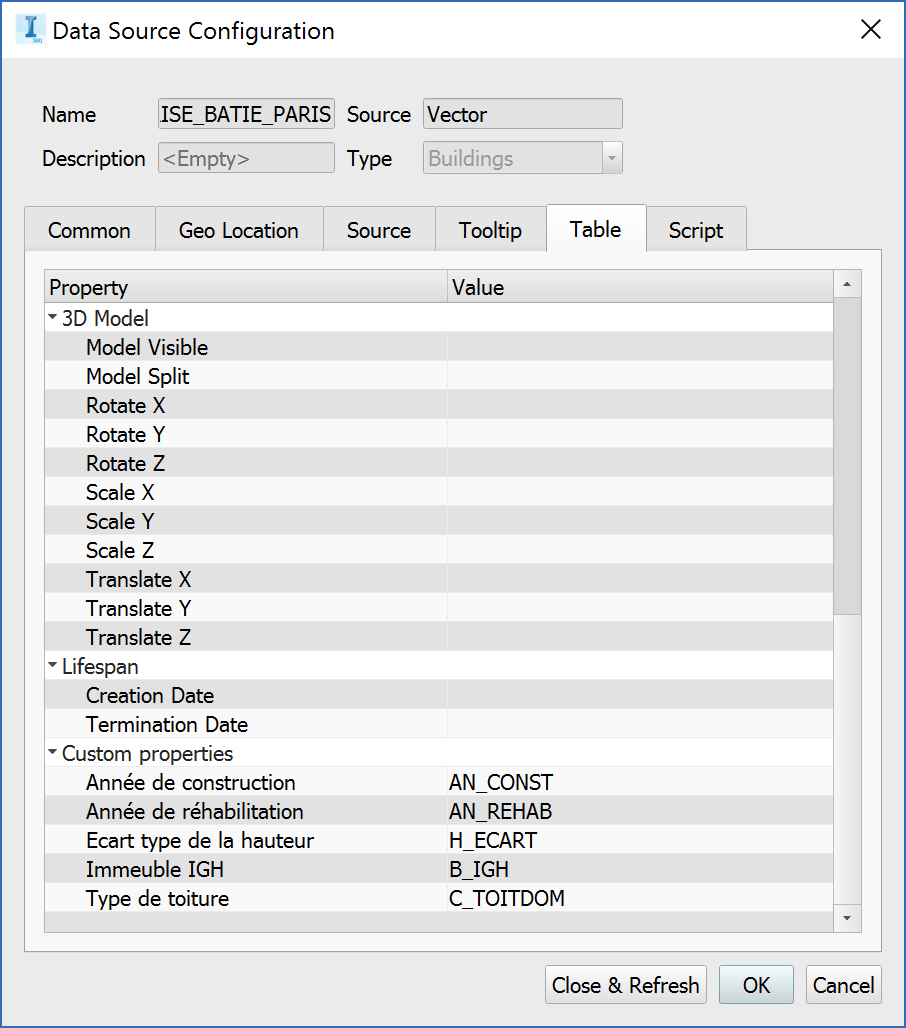 Mapping custom fields
Since my data contains the type of roofing material of the building, I create a rule to match the appearance of the building with my dataset. These Roof Type values are integers defining a roofing material for every building.
Using great explanations from here, I create a small script to map these values to a roofing material in InfraWorks, with a switch command on the type of roof described in the dataset.
//Added by me
switch (SOURCE["C_TOITDOM"])
{
case 0: BUILDINGS.ROOF_MATERIAL = "Material/Roofing/Spanish Tile Brown";
break;
case 1: BUILDINGS.ROOF_MATERIAL = "Material/Roofing/Spanish Tile Brown";
break;
case 2: BUILDINGS.ROOF_MATERIAL = "Material/Roofing/Zinc";
break;
case 3: BUILDINGS.ROOF_MATERIAL = "Material/Roofing/Slate Grey";
break;
case 4: BUILDINGS.ROOF_MATERIAL = "Material/Roofing/Masonry Stone Black";
break;
case 5: BUILDINGS.ROOF_MATERIAL = "Material/Roofing/Grass Augustine";
break;
default: BUILDINGS.ROOF_MATERIAL = "Material/Roofing/Spanish Tile Brown";
}
Most of Paris buildings have a very characteristic zinc roof, a material that is not available by default in InfraWorks.
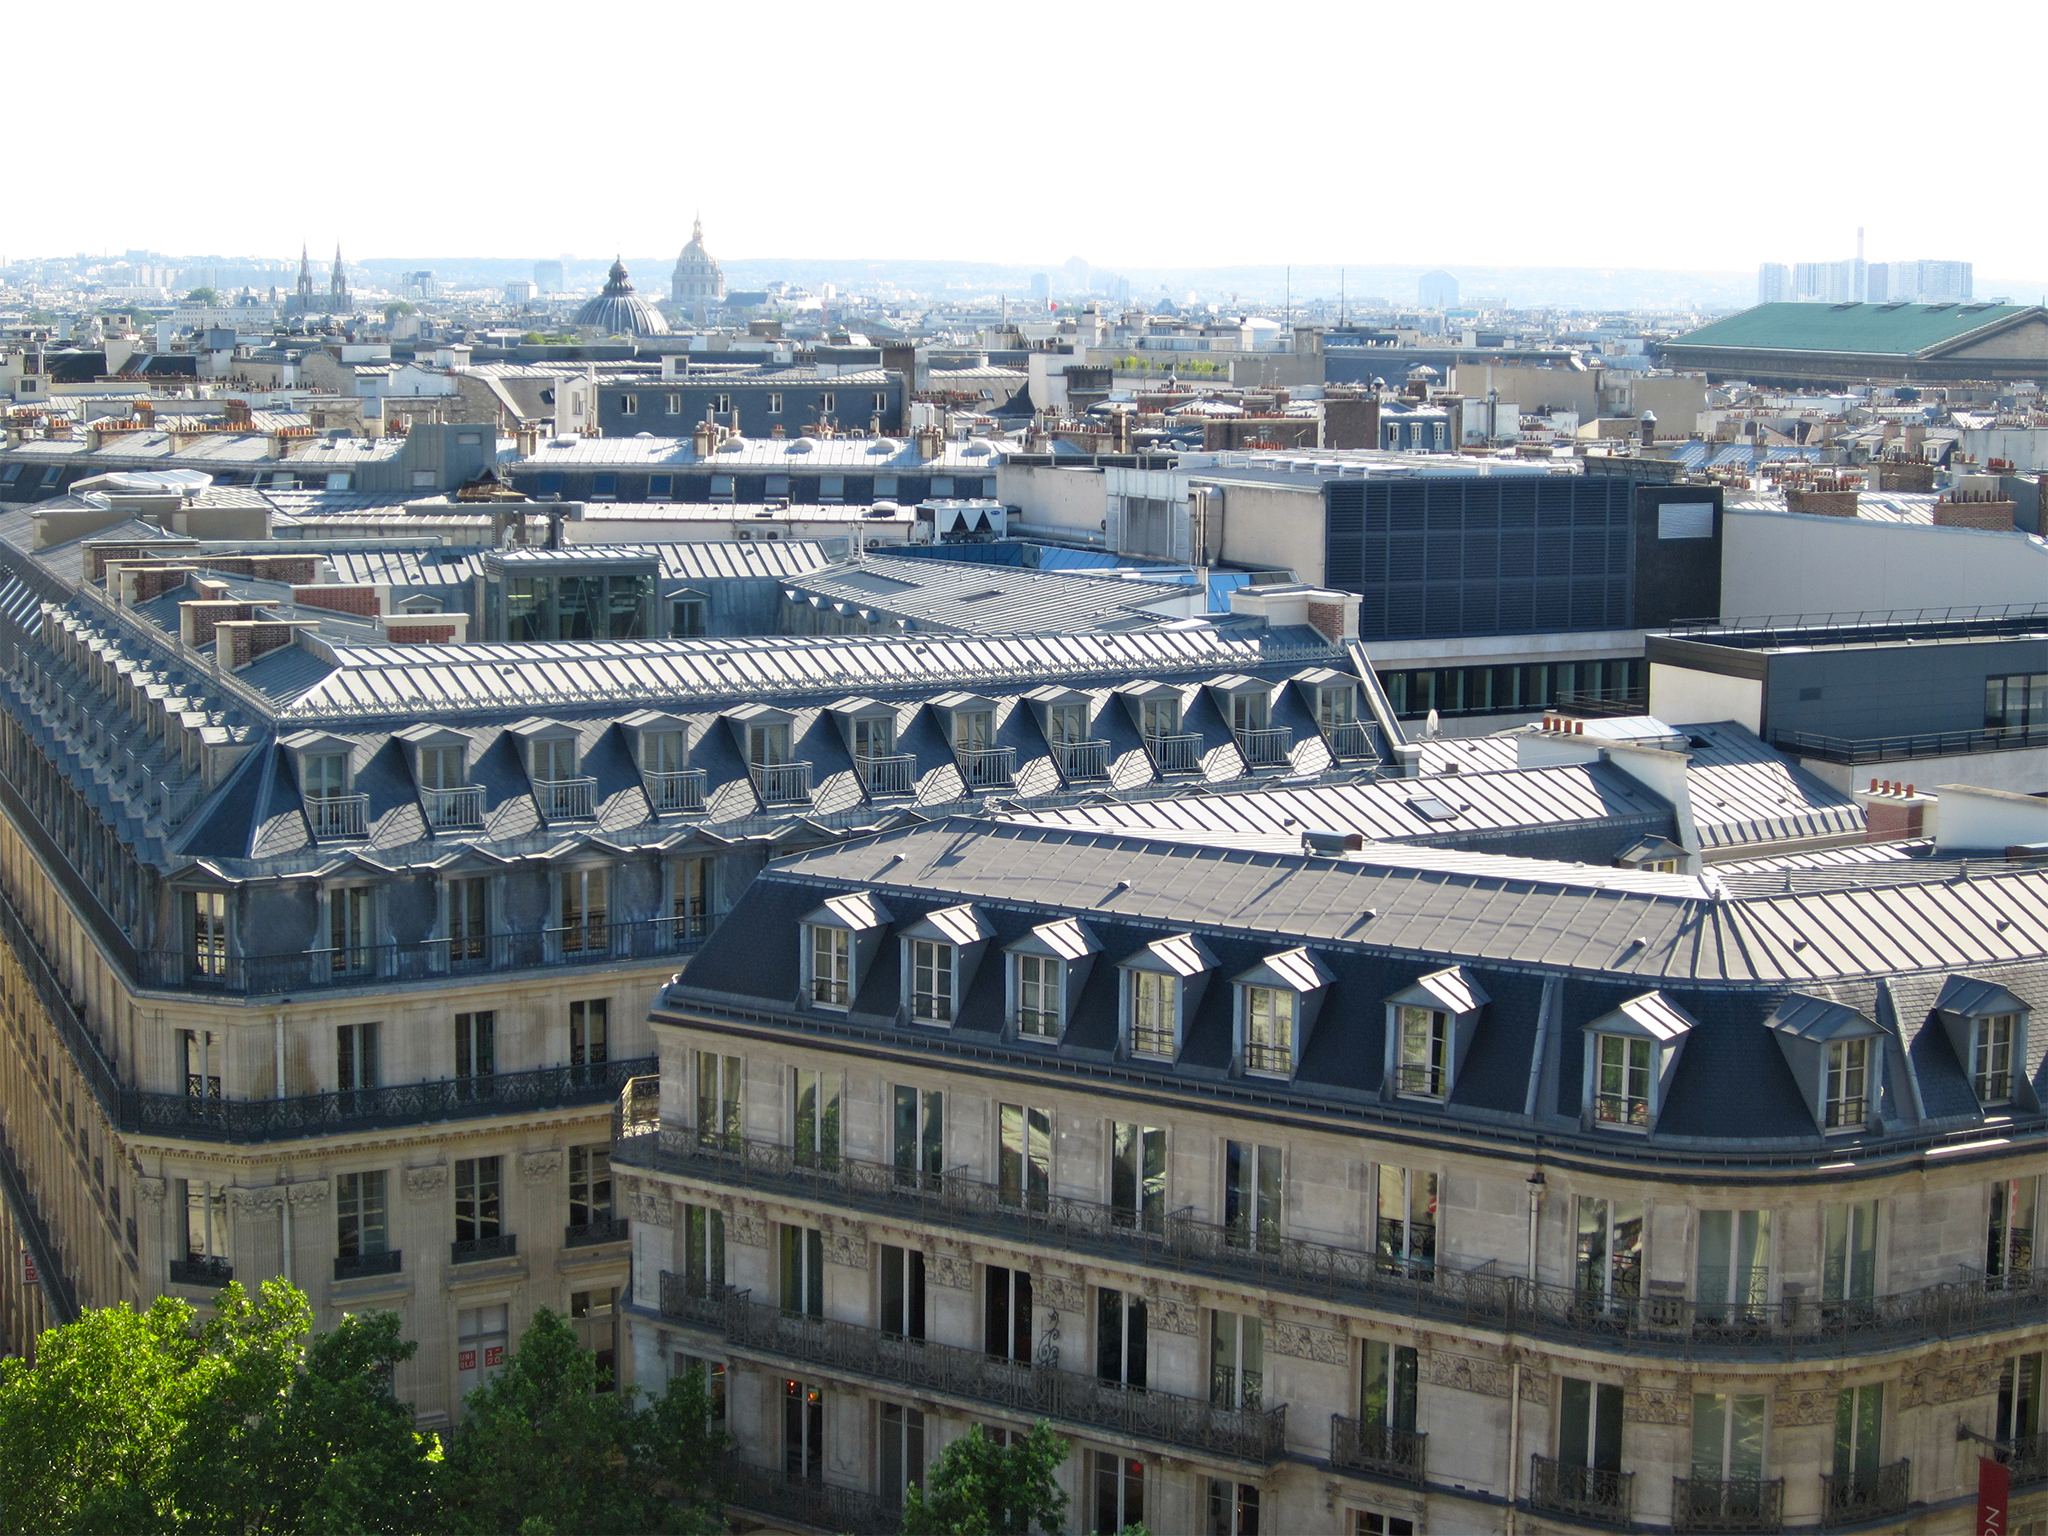 Typical Parisian roofs
Using the style palette, I create my own zinc material from a picture and a few settings.
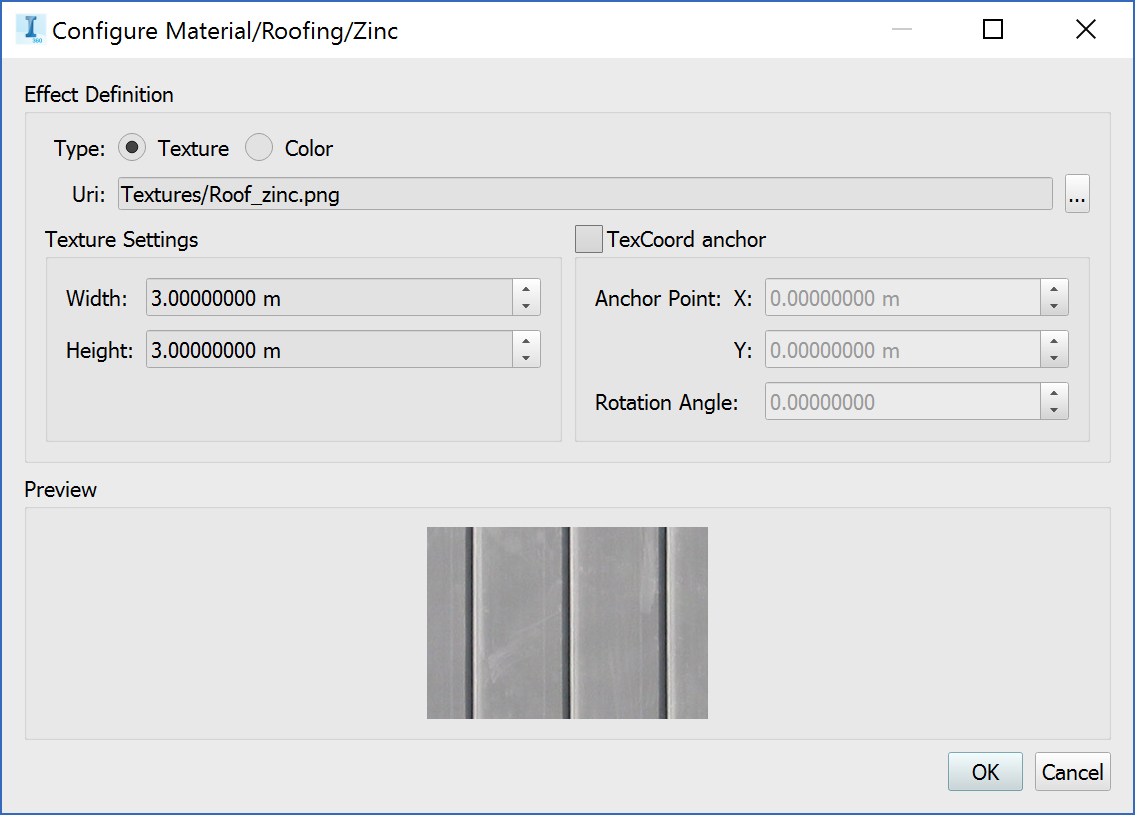 Creating a custom “Zinc” material
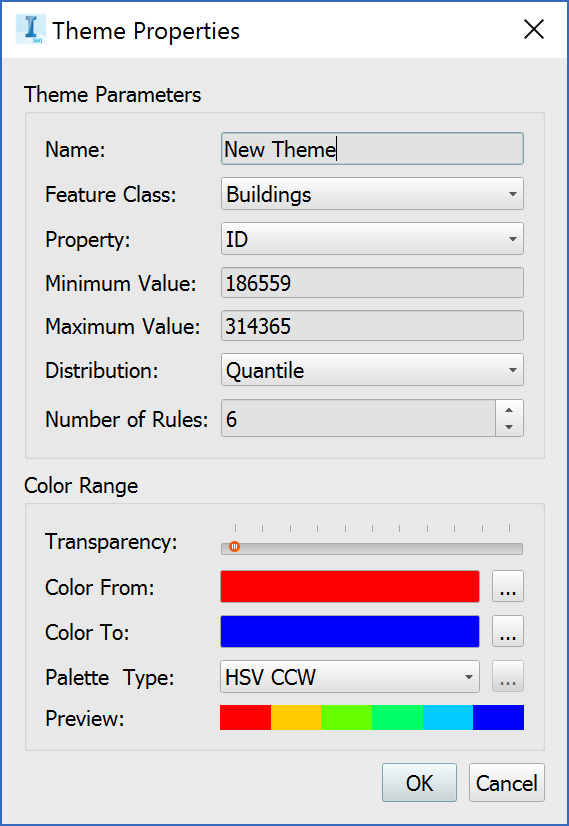
My final experiment was to use the Feature Themes tab to display construction dates for Parisian buildings.
This function allows me to add a color scheme to my buildings to display values, here the construction date.
The result in quite compelling, every building is displayed in color per its construction date.
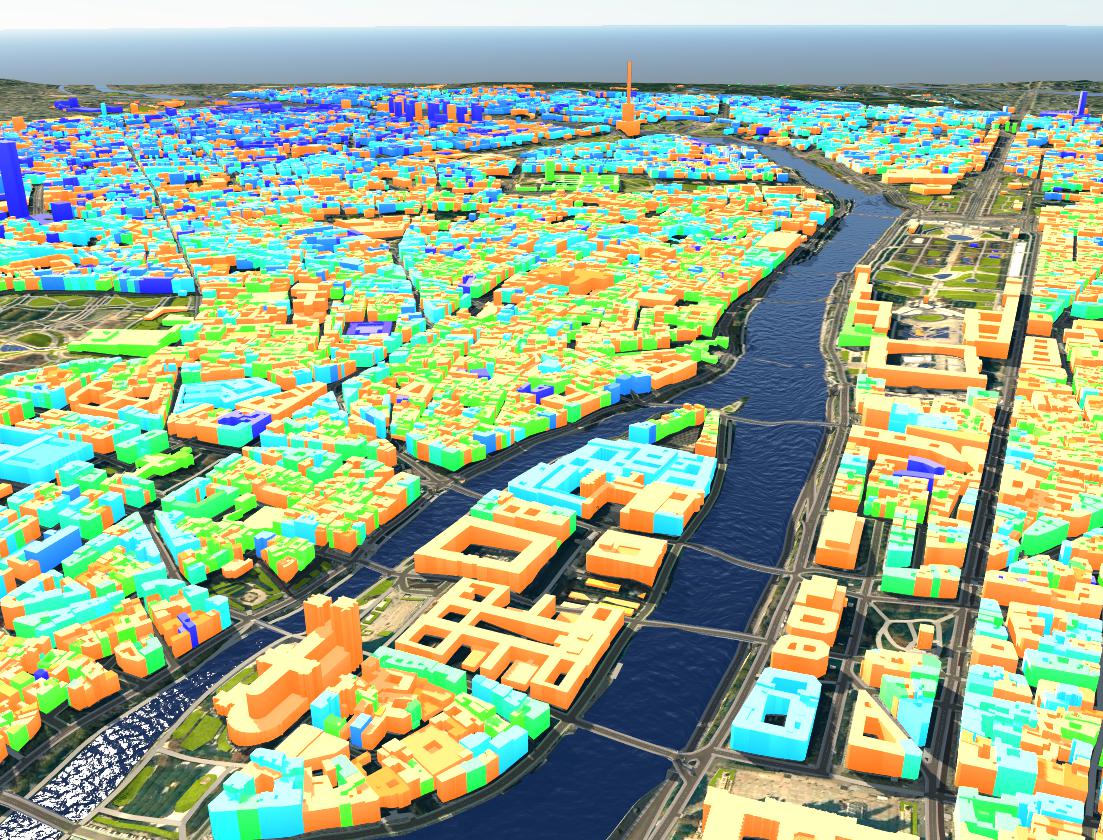 Displaying construction dates
Building models of entire cities is incredibly easy with InfraWorks, and as long as you have correct data sources, it seems to be the perfect tool to re-create the environment for your studies.