Since bimsync has become my main tool for visualizing and analysing building models, I am working on expanding this tool to leverage its power. Among the long list of features I am dreaming of, the most important is to be able to see and interpret non-geometric data, like properties and quantities.
bimsync already provide a function to extract quantities from a model and download them as an Excel spreadsheet. However, to be able to bring this data to the mass involve more than csv spreadsheets with raw data. Row upon row of IFC properties does not brings any useful insight to design a building and I was looking for something that could tell a story based on this information.
There is already a handful of tools to extract data from Revit to display them in a dashboard. For example, the Dynamo package dynaBleau from Kyle Morin extract data from Revit to display it in the dataviz software Tableau. In the same spirit, Ryan Cameron is using Dynamo to create an Excel spreadsheet easily visualized in Power BI. The Flux Dashboard was also something that I was looking to reproduce for bimsync.
Inspired by all these great solutions, I created my own for bimsync. Since I was already familiar with Power BI, the data visualization package from Microsoft, I used it to display data extracted from bimsync.
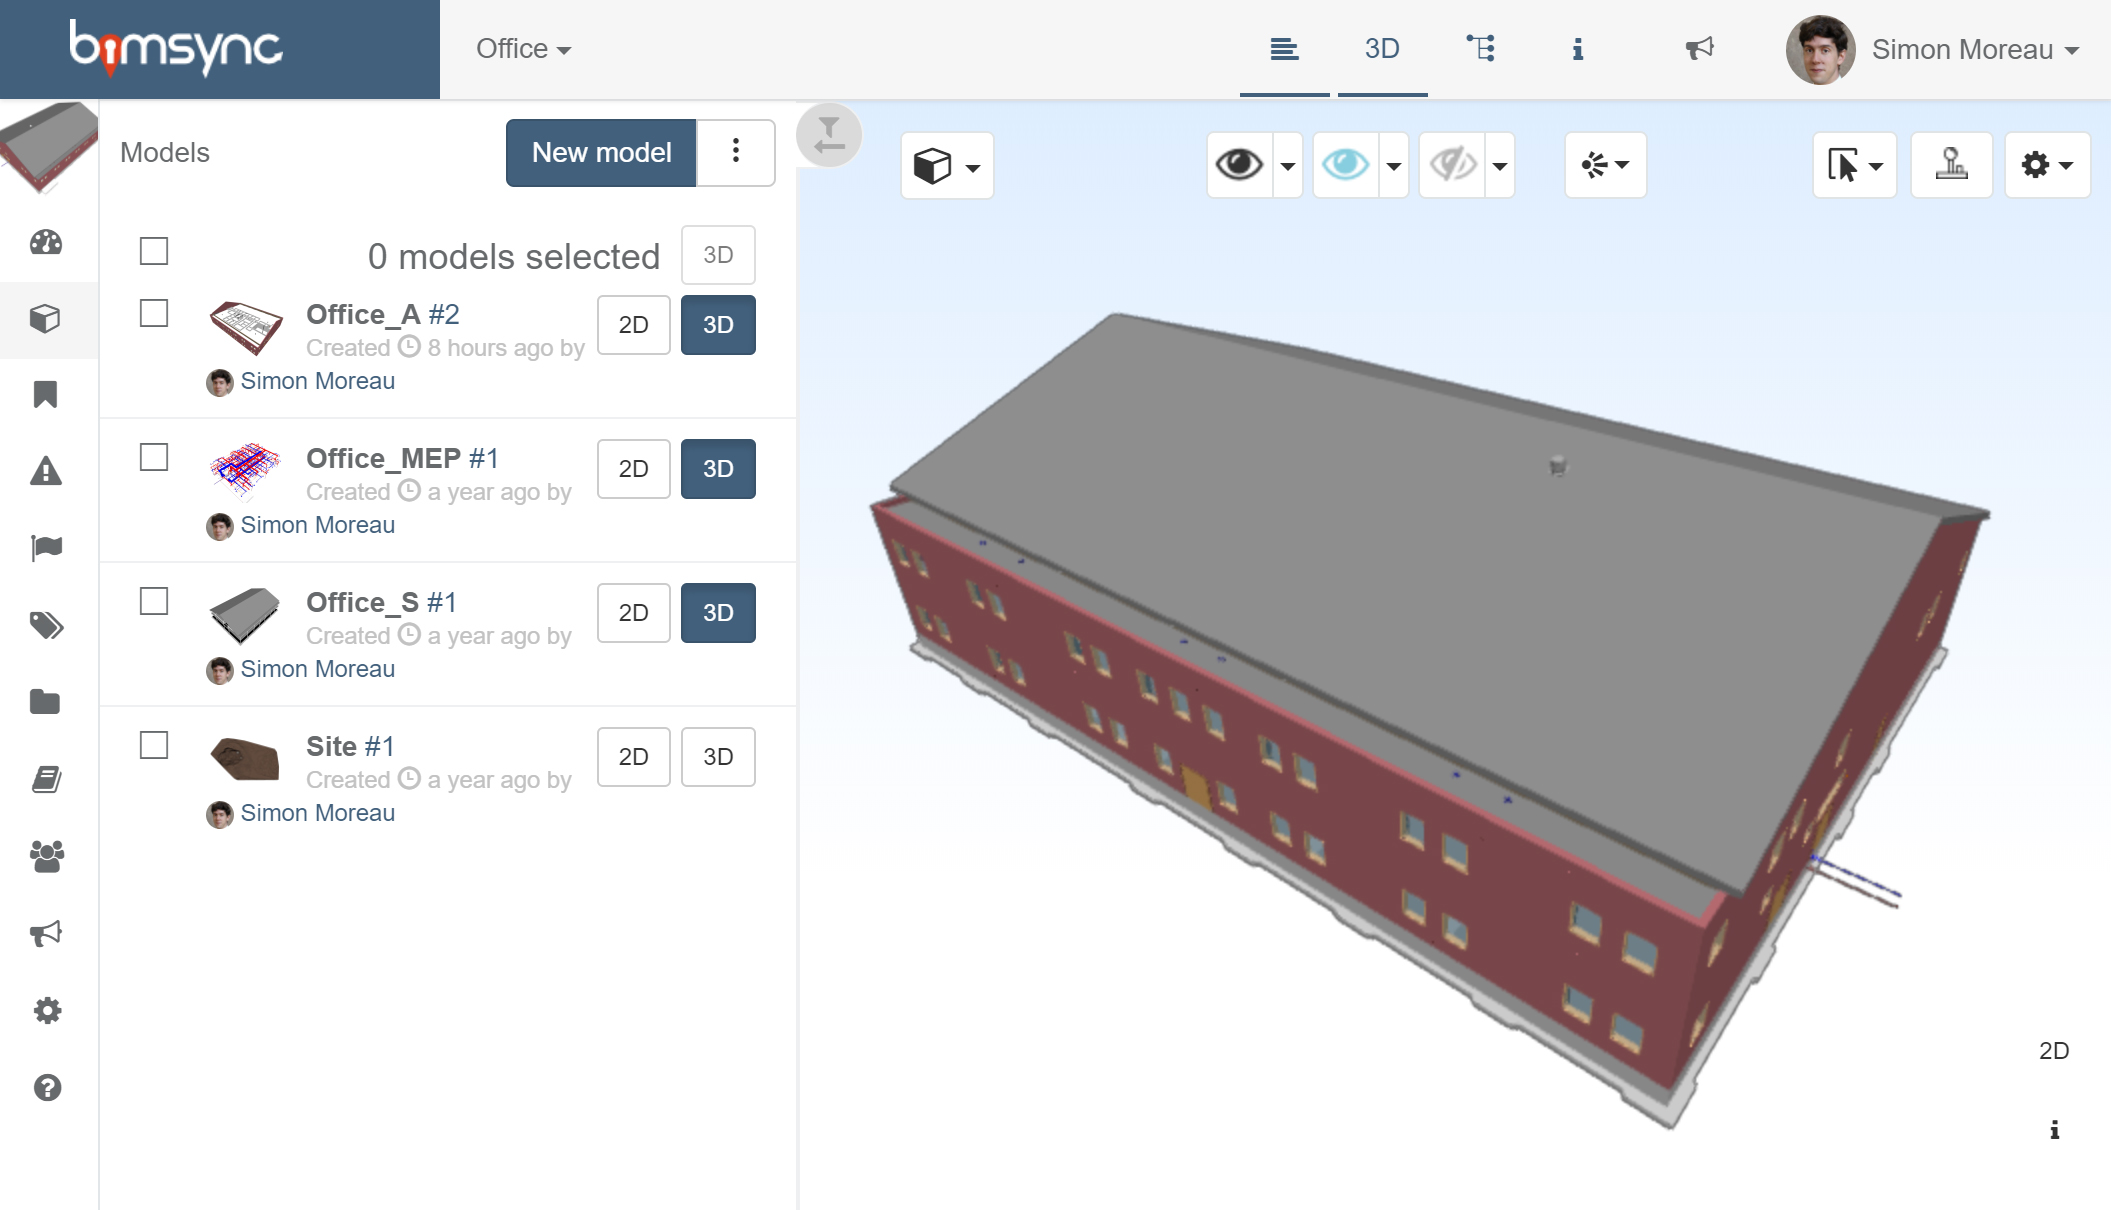
I was able to go from this, a bimsync project based on the IFC sample files:
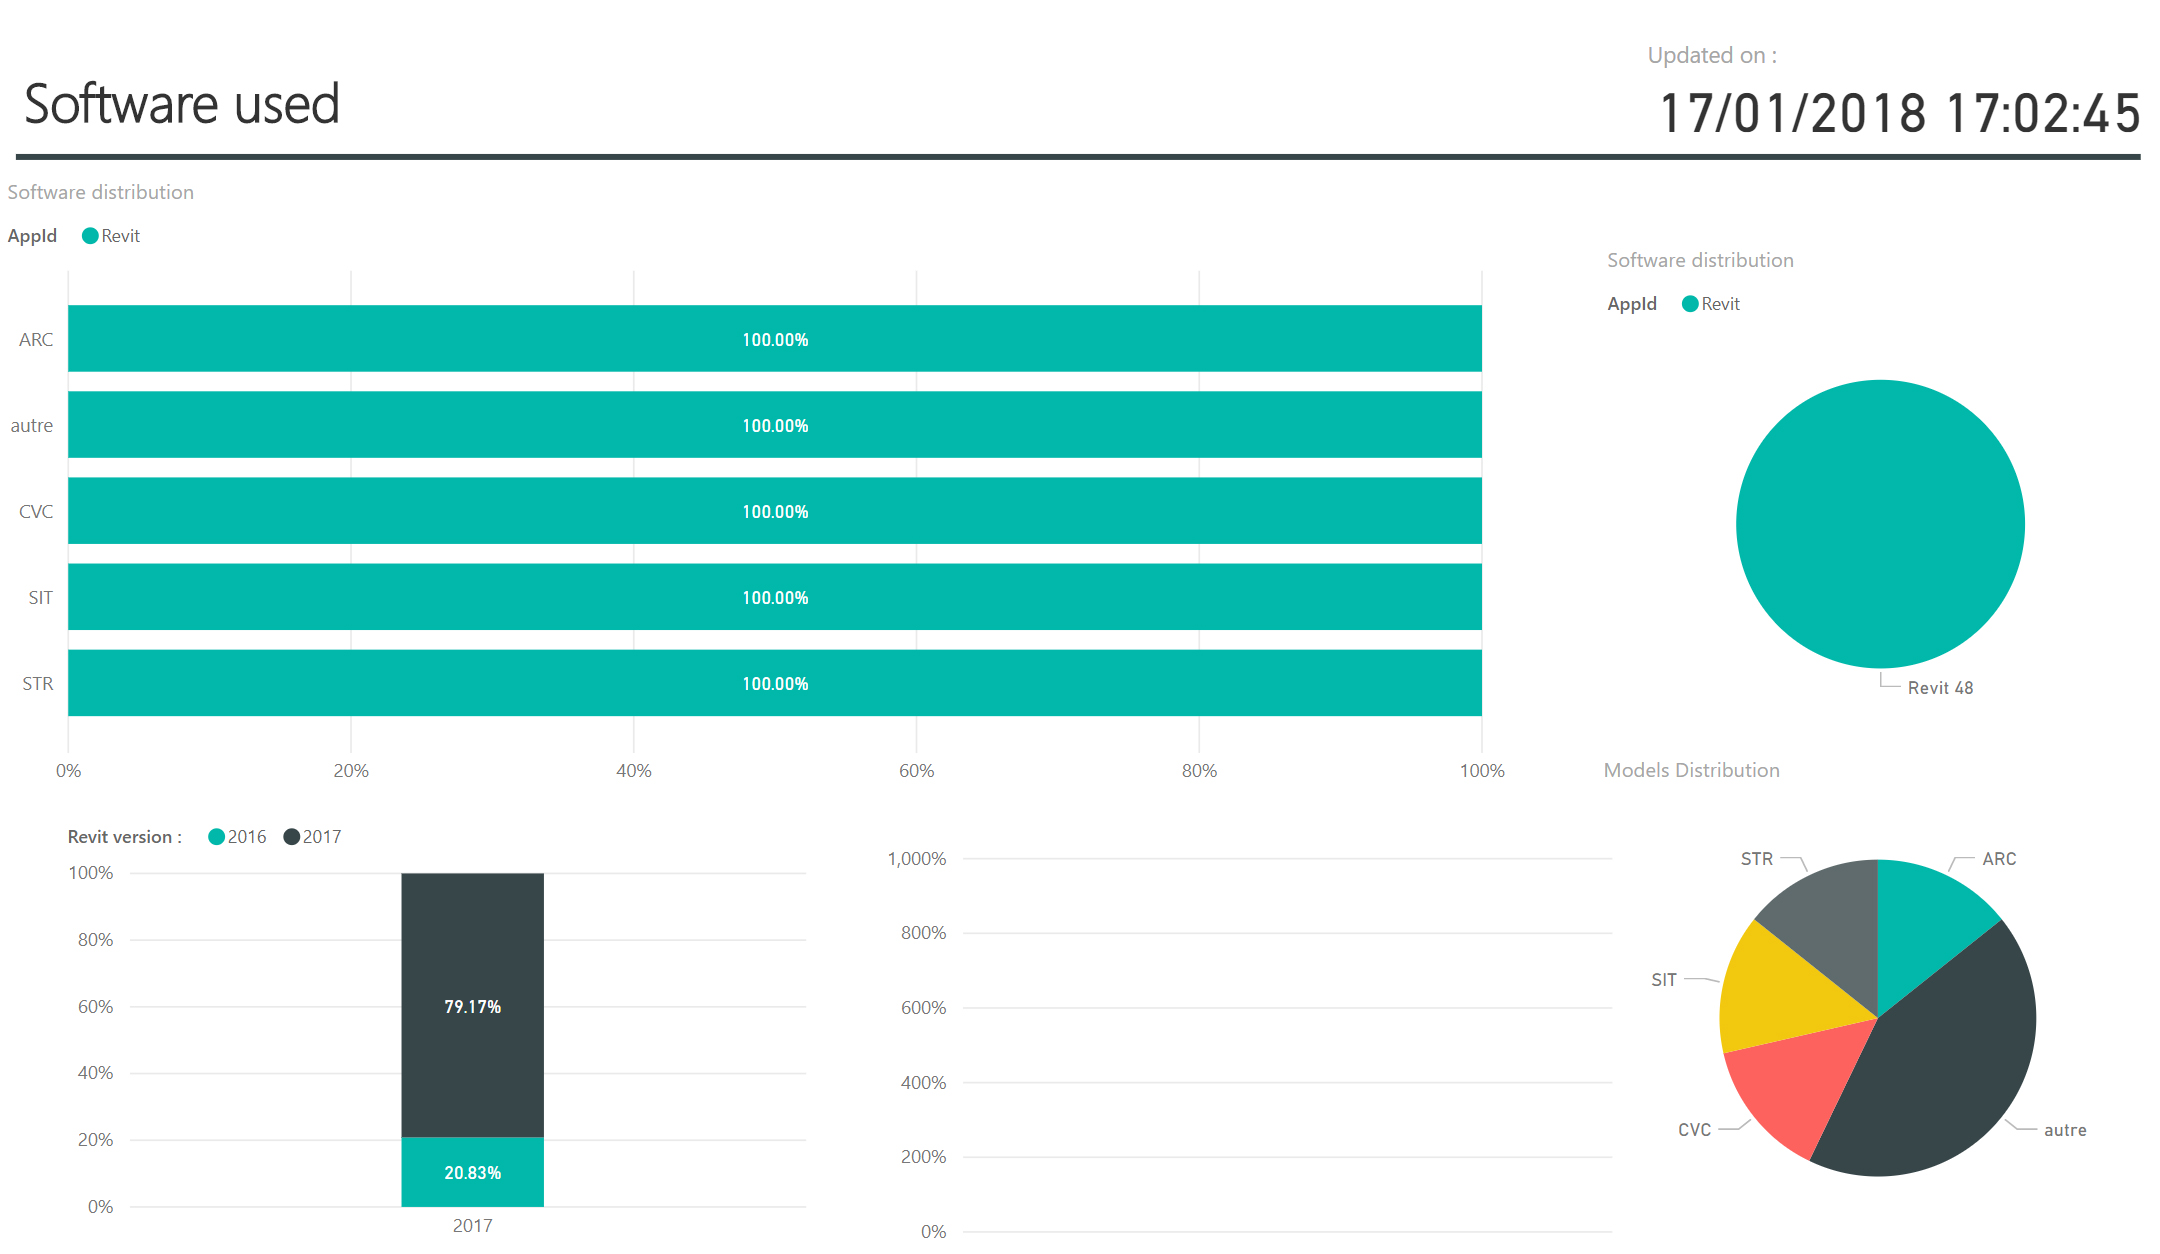
To this interactive Power BI dashboard displaying data extracted from these models:
After some time as an internal product, I finally take the time to package this into a coherent solution, which is now available here: bimsync Manager
The bimsync Manager website provide the documentation to help you connect your bimsync account to Power BI.
What can you do with it?
The bimsync Manager come with two samples dashboards, one to analyse all your bimsync projects for global insights, and another to extract quantities from a specific bimsync project.
The Global Dashboard extract information about models, revisions, users, and members across all your bimsync projects.
As an example, we use it internally to manage BIM deployment across all our offices and understand usage and adoption of bimsync by my colleague and external partners. You can also use it retrieve all IfcOwnerHistory of uploaded IFC models. As an example, we use it to understand the distribution of authoring software used on these projects.
For performance reason, you can’t use it to extract more detailed information like quantities or issues. To do so, you must use the second dashboard.
The Project Dashboard allows you to extract all quantities for every IFC categories for every model uploaded to a specific bimsync project. A Relations table gives you all IfcRelationship in your models, allowing you to retrieve relations between an element and its level, or between a space and its IfcZone.
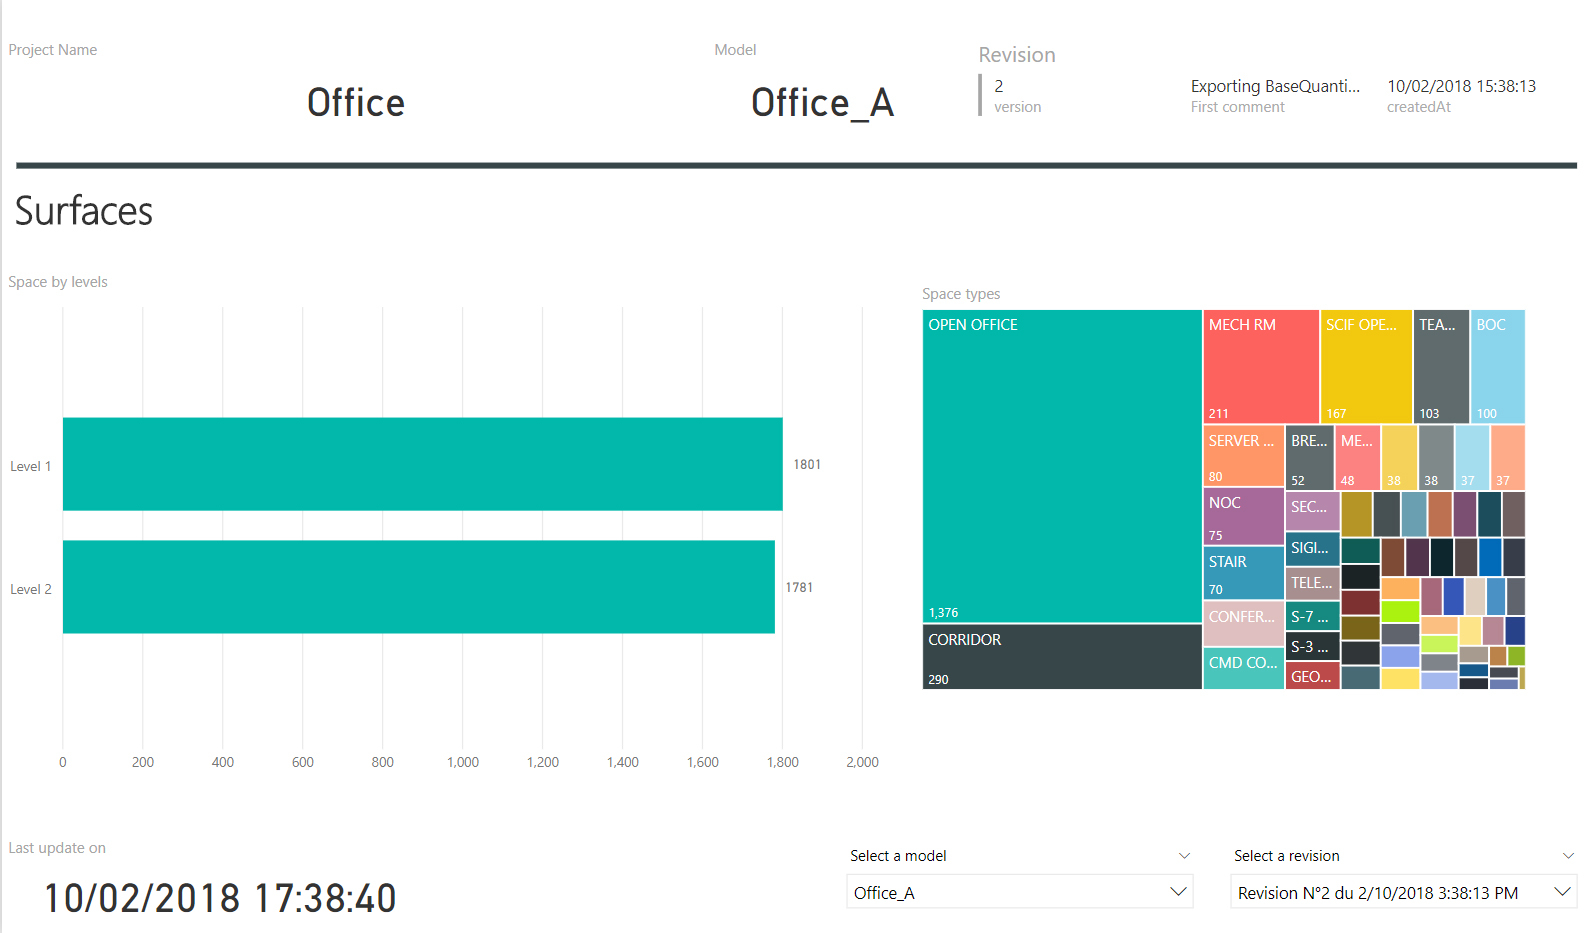
Still for performance reason, you can only extract data from the 2 last revisions from each model. However, this can be easily modified by editing the GetElements function in Power BI.
These two dashboards are only starting points, you can use them to create your own routines for extracting data out of bimsync.
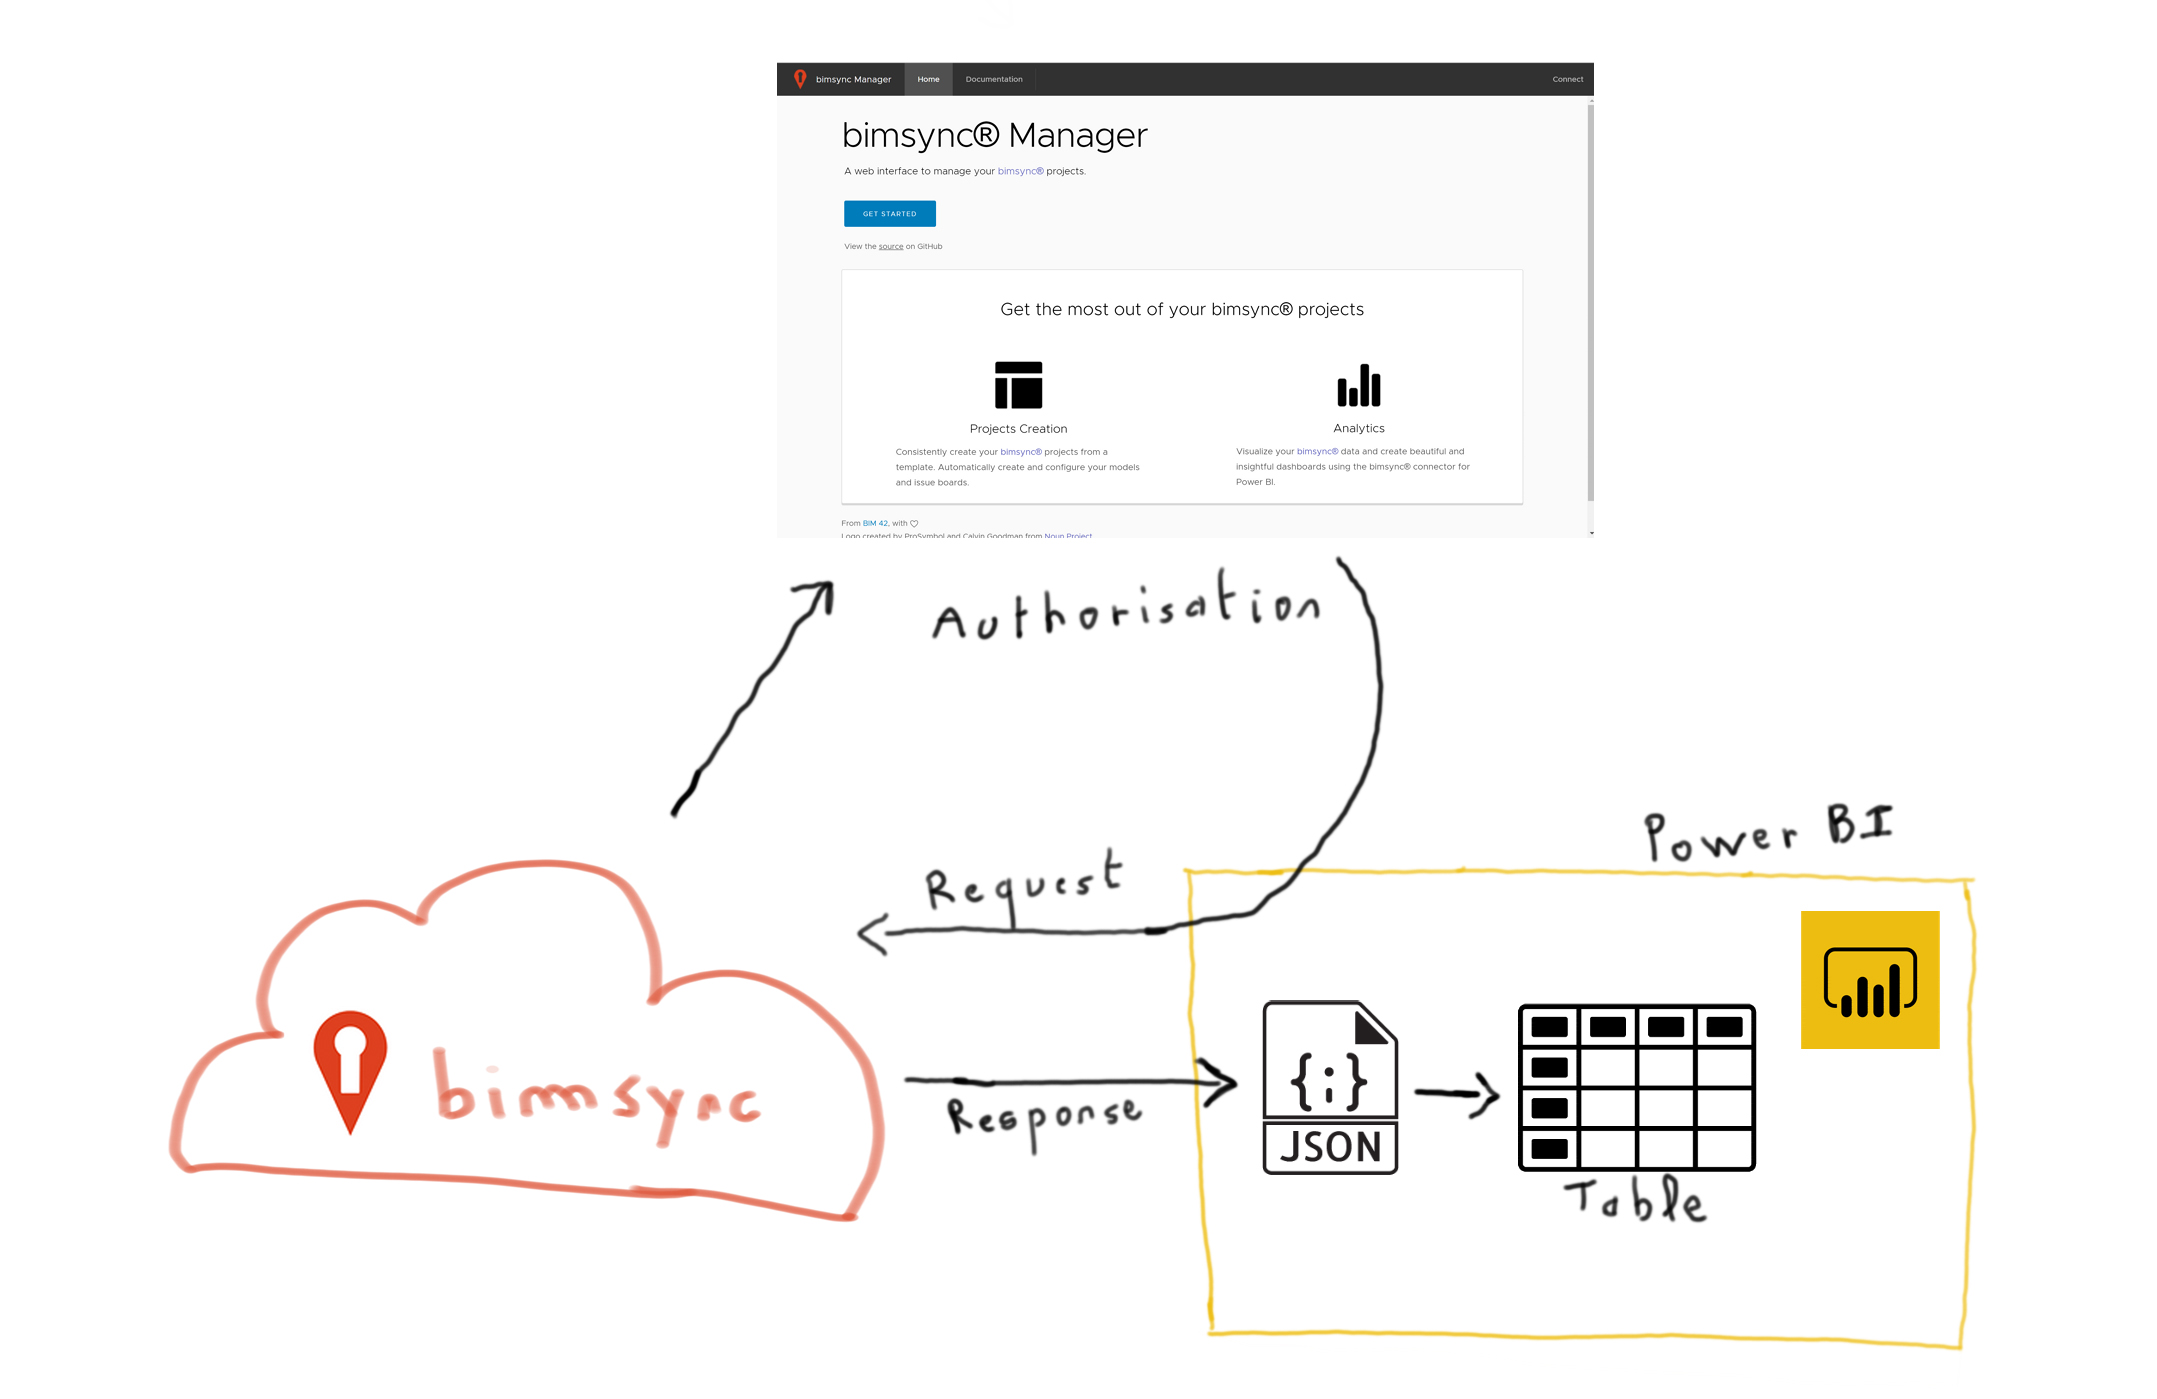
How it works?
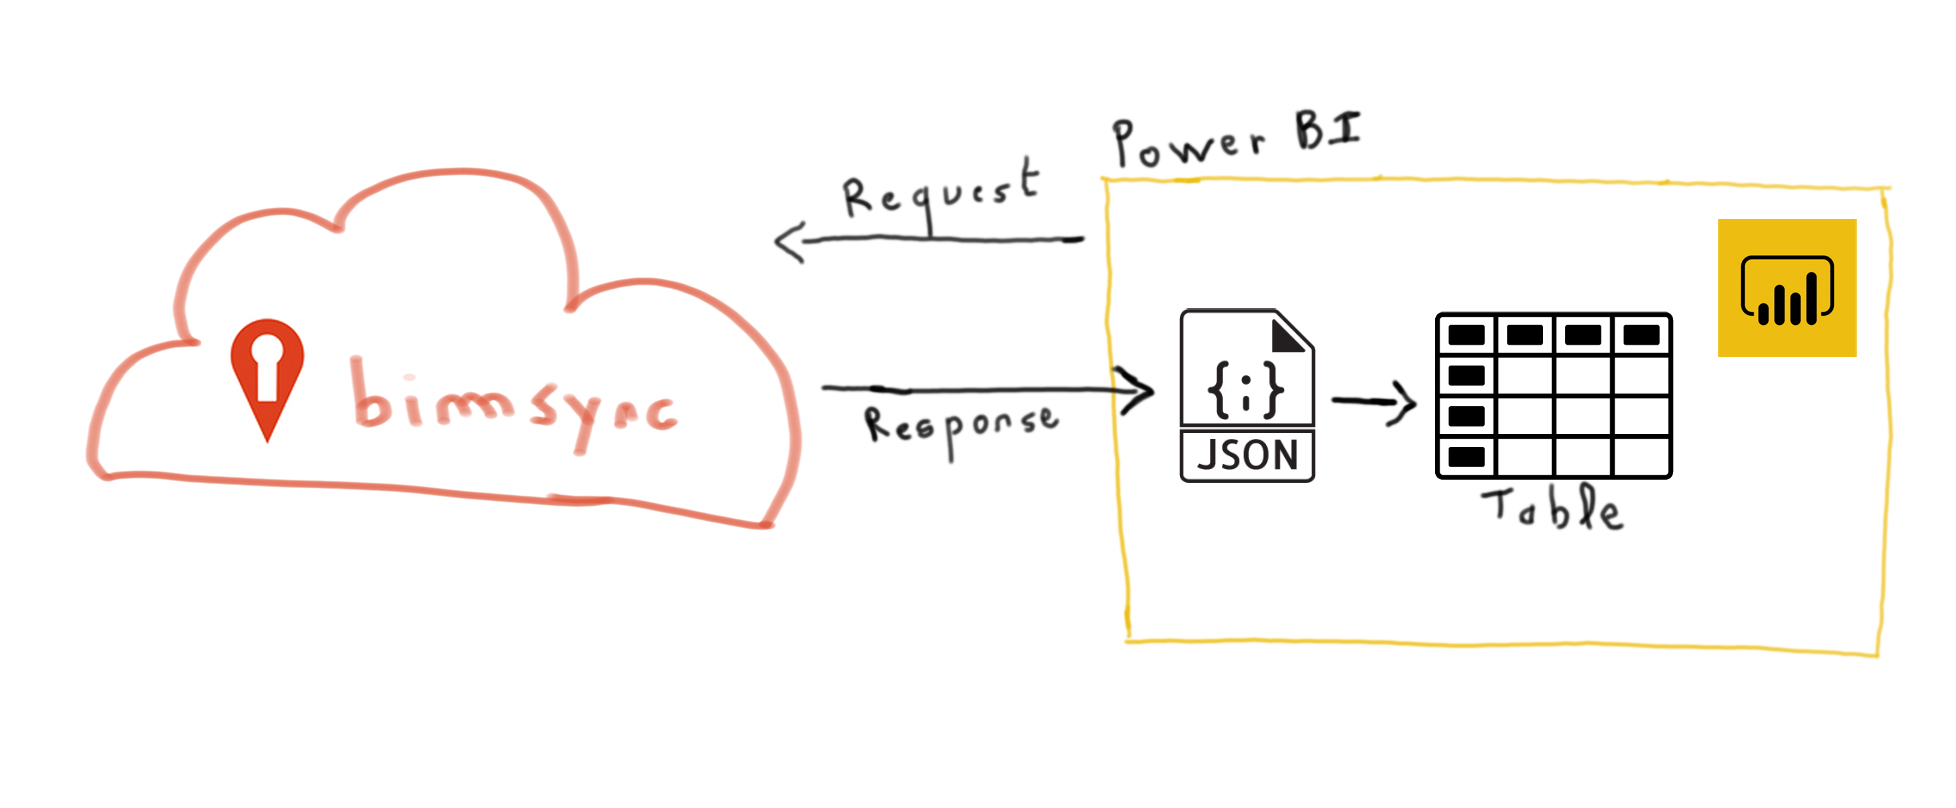
Each Power BI file comes with all necessary queries to retrieve data from bimsync through its public API. Power BI send a request and retrieve all the elements of a given IFC category in Json. A second function parse these elements to fill a table. Columns are dynamically created based on the property sets available in the elements. These functions are written in M Query, the Power BI request language. They can be easily edited by clicking on “Edit Queries” in Power BI Desktop.
However, some mandatory functions, namely oAuth authentication and responses pagination cannot be handled with M Query alone. To be able to authenticate my queries in Power BI, I build a web service with two main functions. The first one is managing authentication, any call to it from Power BI give back an access token to be used by Power BI. The other one is handling pagination. A request to this service give back the number of item expected in the answer, which allows Power BI to know how many queries it will have to run to retrieve all elements. This service is hosted on bimsync Manager.
The entire solution is open source, and available across two Github repositories. The bimsyncManager contains the bimsync Manager website, the front-end part of the service, written in Angular. This is also where you can find the two Power BI templates. The bimsyncmanagerAPI is the headless API used to manage user authentication and request pagination. This service is built with .Net Core.
Bimsync Manager is still in its infancy, but I hope to improve on it and made it my go-to tool to display data extracted from models uploaded on bimsync.