Finding and solving issues is at the heart of the spatial coordination process. But since we don’t know in advance how many issues we will have to find and solve, it is difficult to measure the result of our efforts.
Case recently presented a very interesting solution for this problem. Using Jira, an issue tracking product used in the software industry, they were able to keep track of every problems found during the design phase, and display them thought nice visualizations.
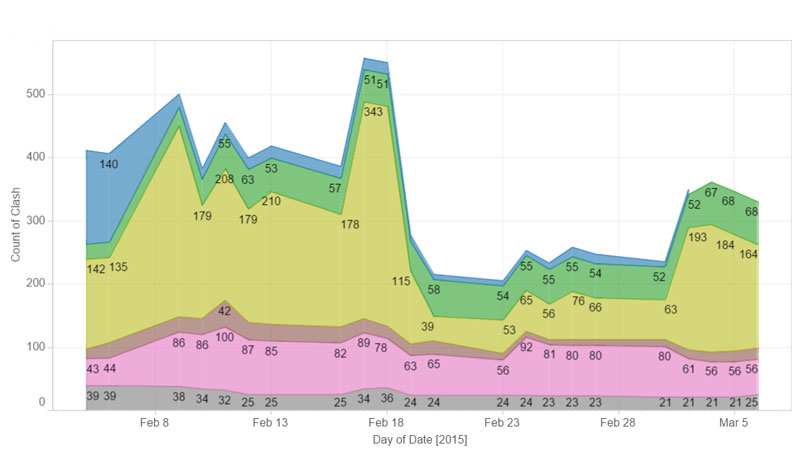
Inspired by this idea, I displayed over time the results of a general clash detection in a graph. Like so, we can see the evolution of the number of clashes in our model, and the progress of the spatial coordination.
To do so, we have to set up a general clash matrix, something like this:
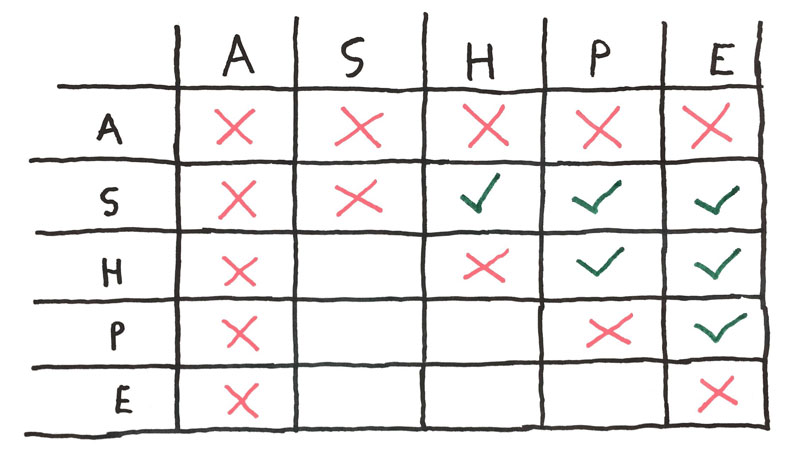
- A: Architecture
- S: Structure
- H: HVAC
- P: Plumbing
- E: Electrical
You can see that the lower-left of the matrix is left blank, we don’t need to run symmetrical tests.
We don’t include architectural elements in our detection, since resulting clashes are generally not relevant enough to add value to the report.
We test for intersections between every trades, create a report combining all clashes, and export it from Navisworks.
This report is not very useful per se. In fact, there is generally too much clashes to sort them into something useful. And if by chance you haven’t that much clashes, you probably don’t need clash detection in the first place. But this clash report do nevertheless represent the state of our coordination at a given date. The less clashes we have, the better.
Furthermore, once these tests are set up in Navisworks, it become easy to export a large clash report every day, a rather bulky summary of every problems we can find in our model.
Day after day, these reports create the raw data for a journal of our spatial coordination. Periodically, we compile them into something more visual.
To do so, we create a single table (in .csv) listing every clash reported during the project.
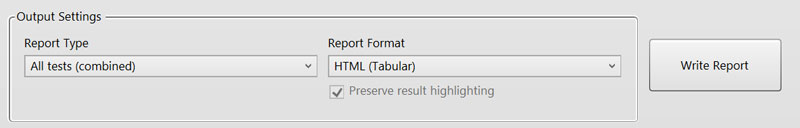
We use to compile them through an HTML (tabular) report from Navisworks.
Using the Data -> From Web Excel function, we create a large database of every clash, with its history.
We now have a custom application for extracting the same information from Navisworks XML reports. The process is somehow automated, but the result is the same, a large database of every clashes detected during the design.
Once we have every clash in a handy (and pretty large) .csv file, we use Tableau to create a nice visualization out of it, and let everyone in the office follow the progress of the coordination.
“What gets measured improves”, and we are now able to increase our efforts when we see the spatial coordination staggering. But with precise data about the coordination, I also hope to be able to better understand what makes a coordination process successful and how to reproduce it.